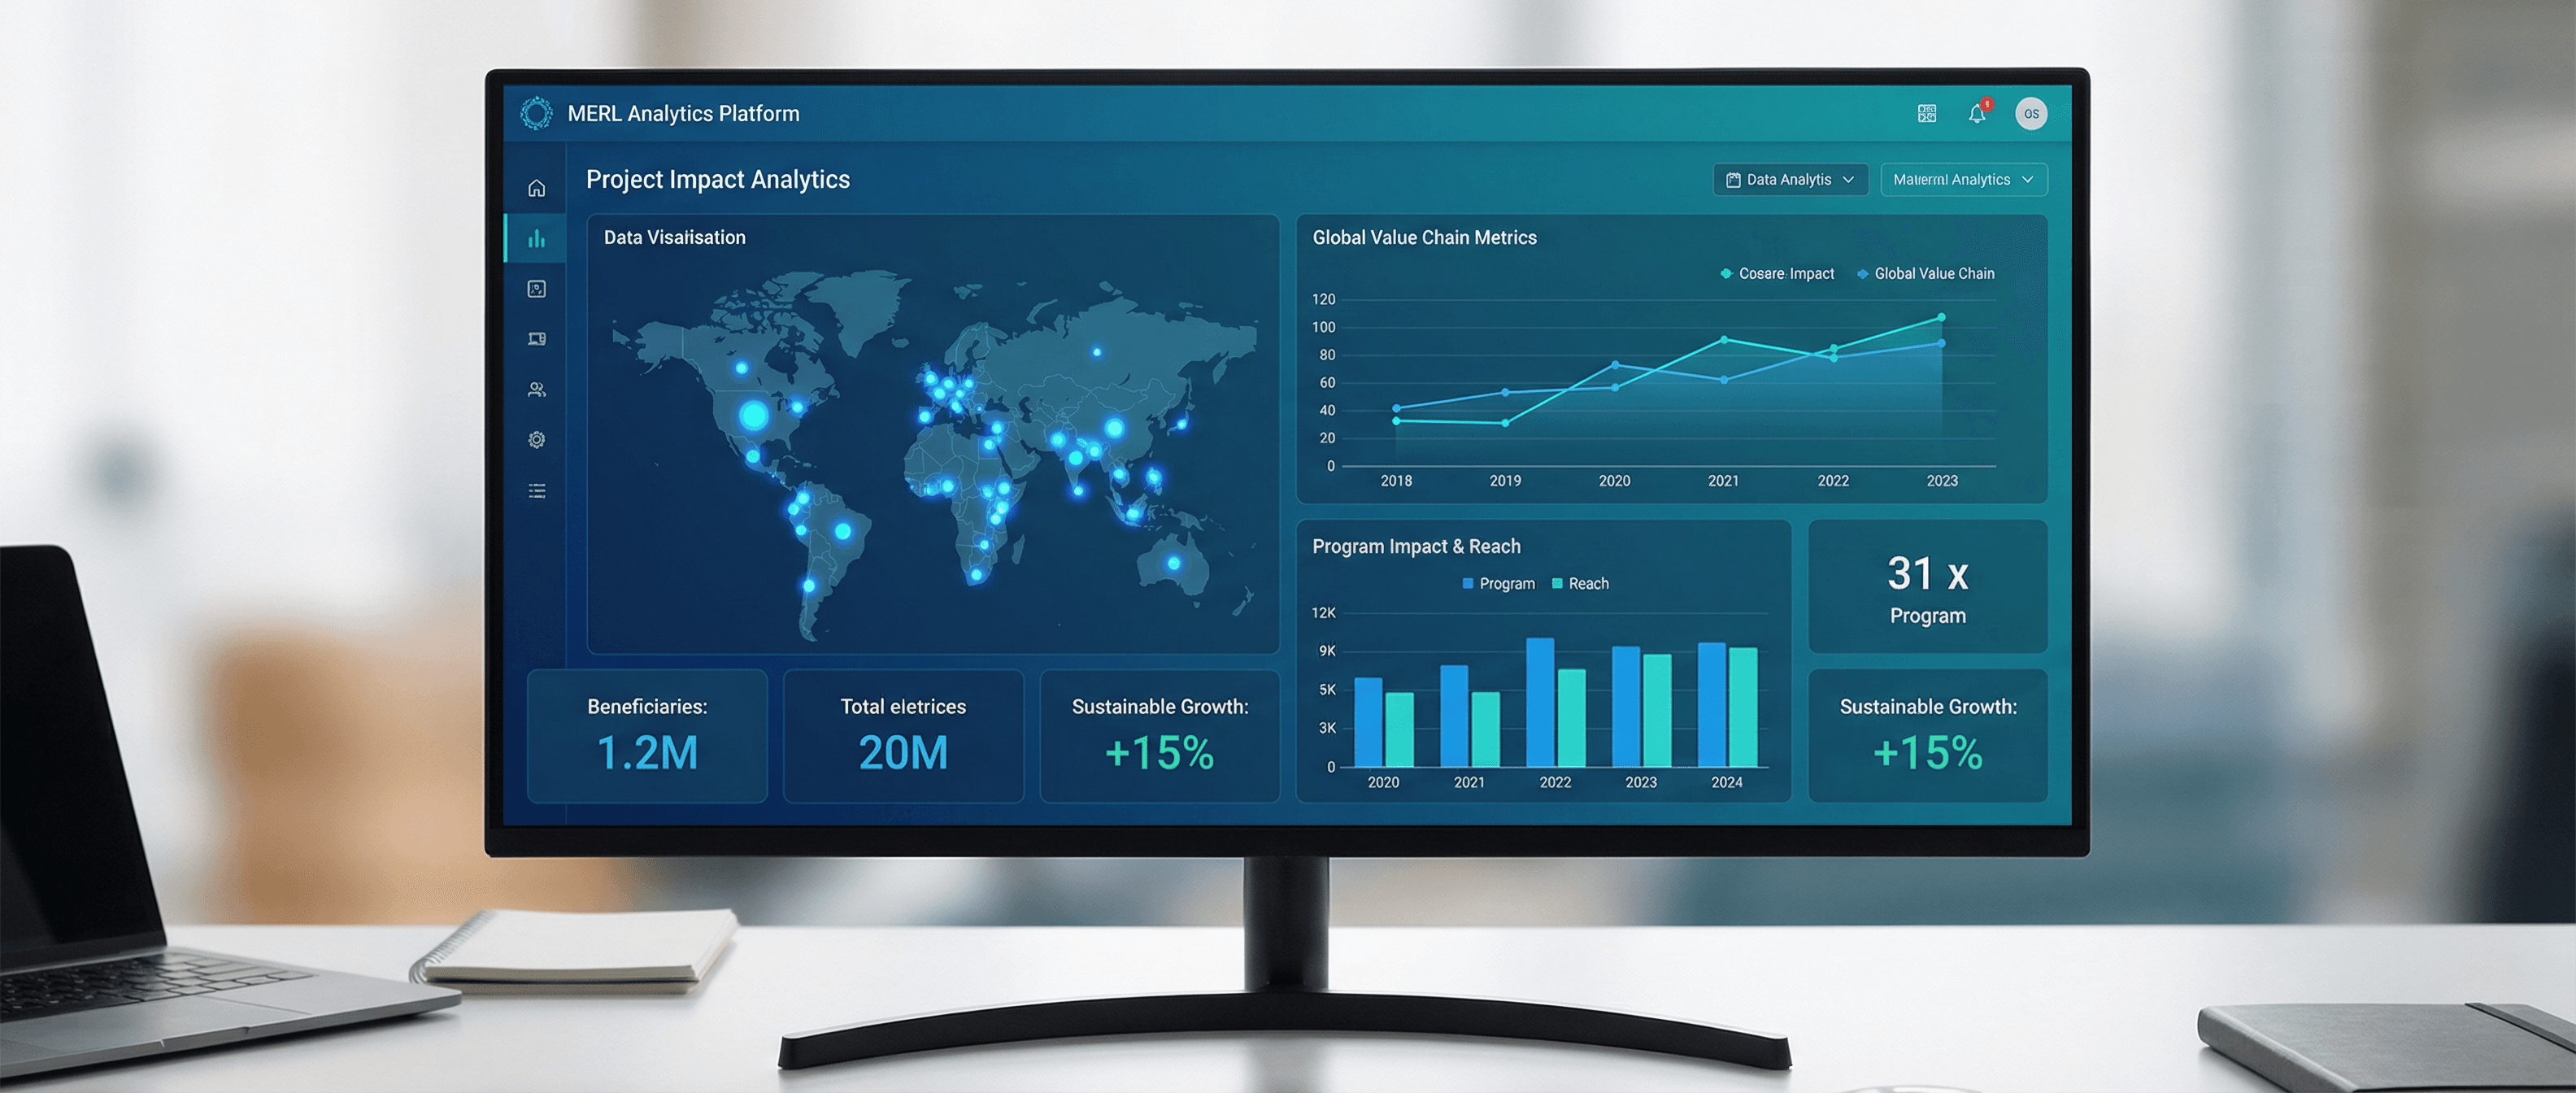
Our data aggregation platform, impact analytics, and MERL (Monitoring, Evaluation, Research & Learning) platform development turn value-chain and programme data into decisions.
The Problem Institutions Face
Cooperatives, NGOs, and governments often lack reliable, timely data on prices, production, and impact. Decisions are made on guesswork, and reporting is manual and slow.
- No single view of prices and trends across value chains.
- Manual data collection and reporting are costly and slow.
- Impact and outcomes are hard to measure and verify.
- Limited use of data for lending and risk assessment.
The Lliffton Solution
We aggregate data across 48+ value chains, apply analytics and projections, and expose insights via dashboards and APIs. Partners use the MIS for pricing, planning, and impact reporting—and financial institutions use it to support lending decisions.
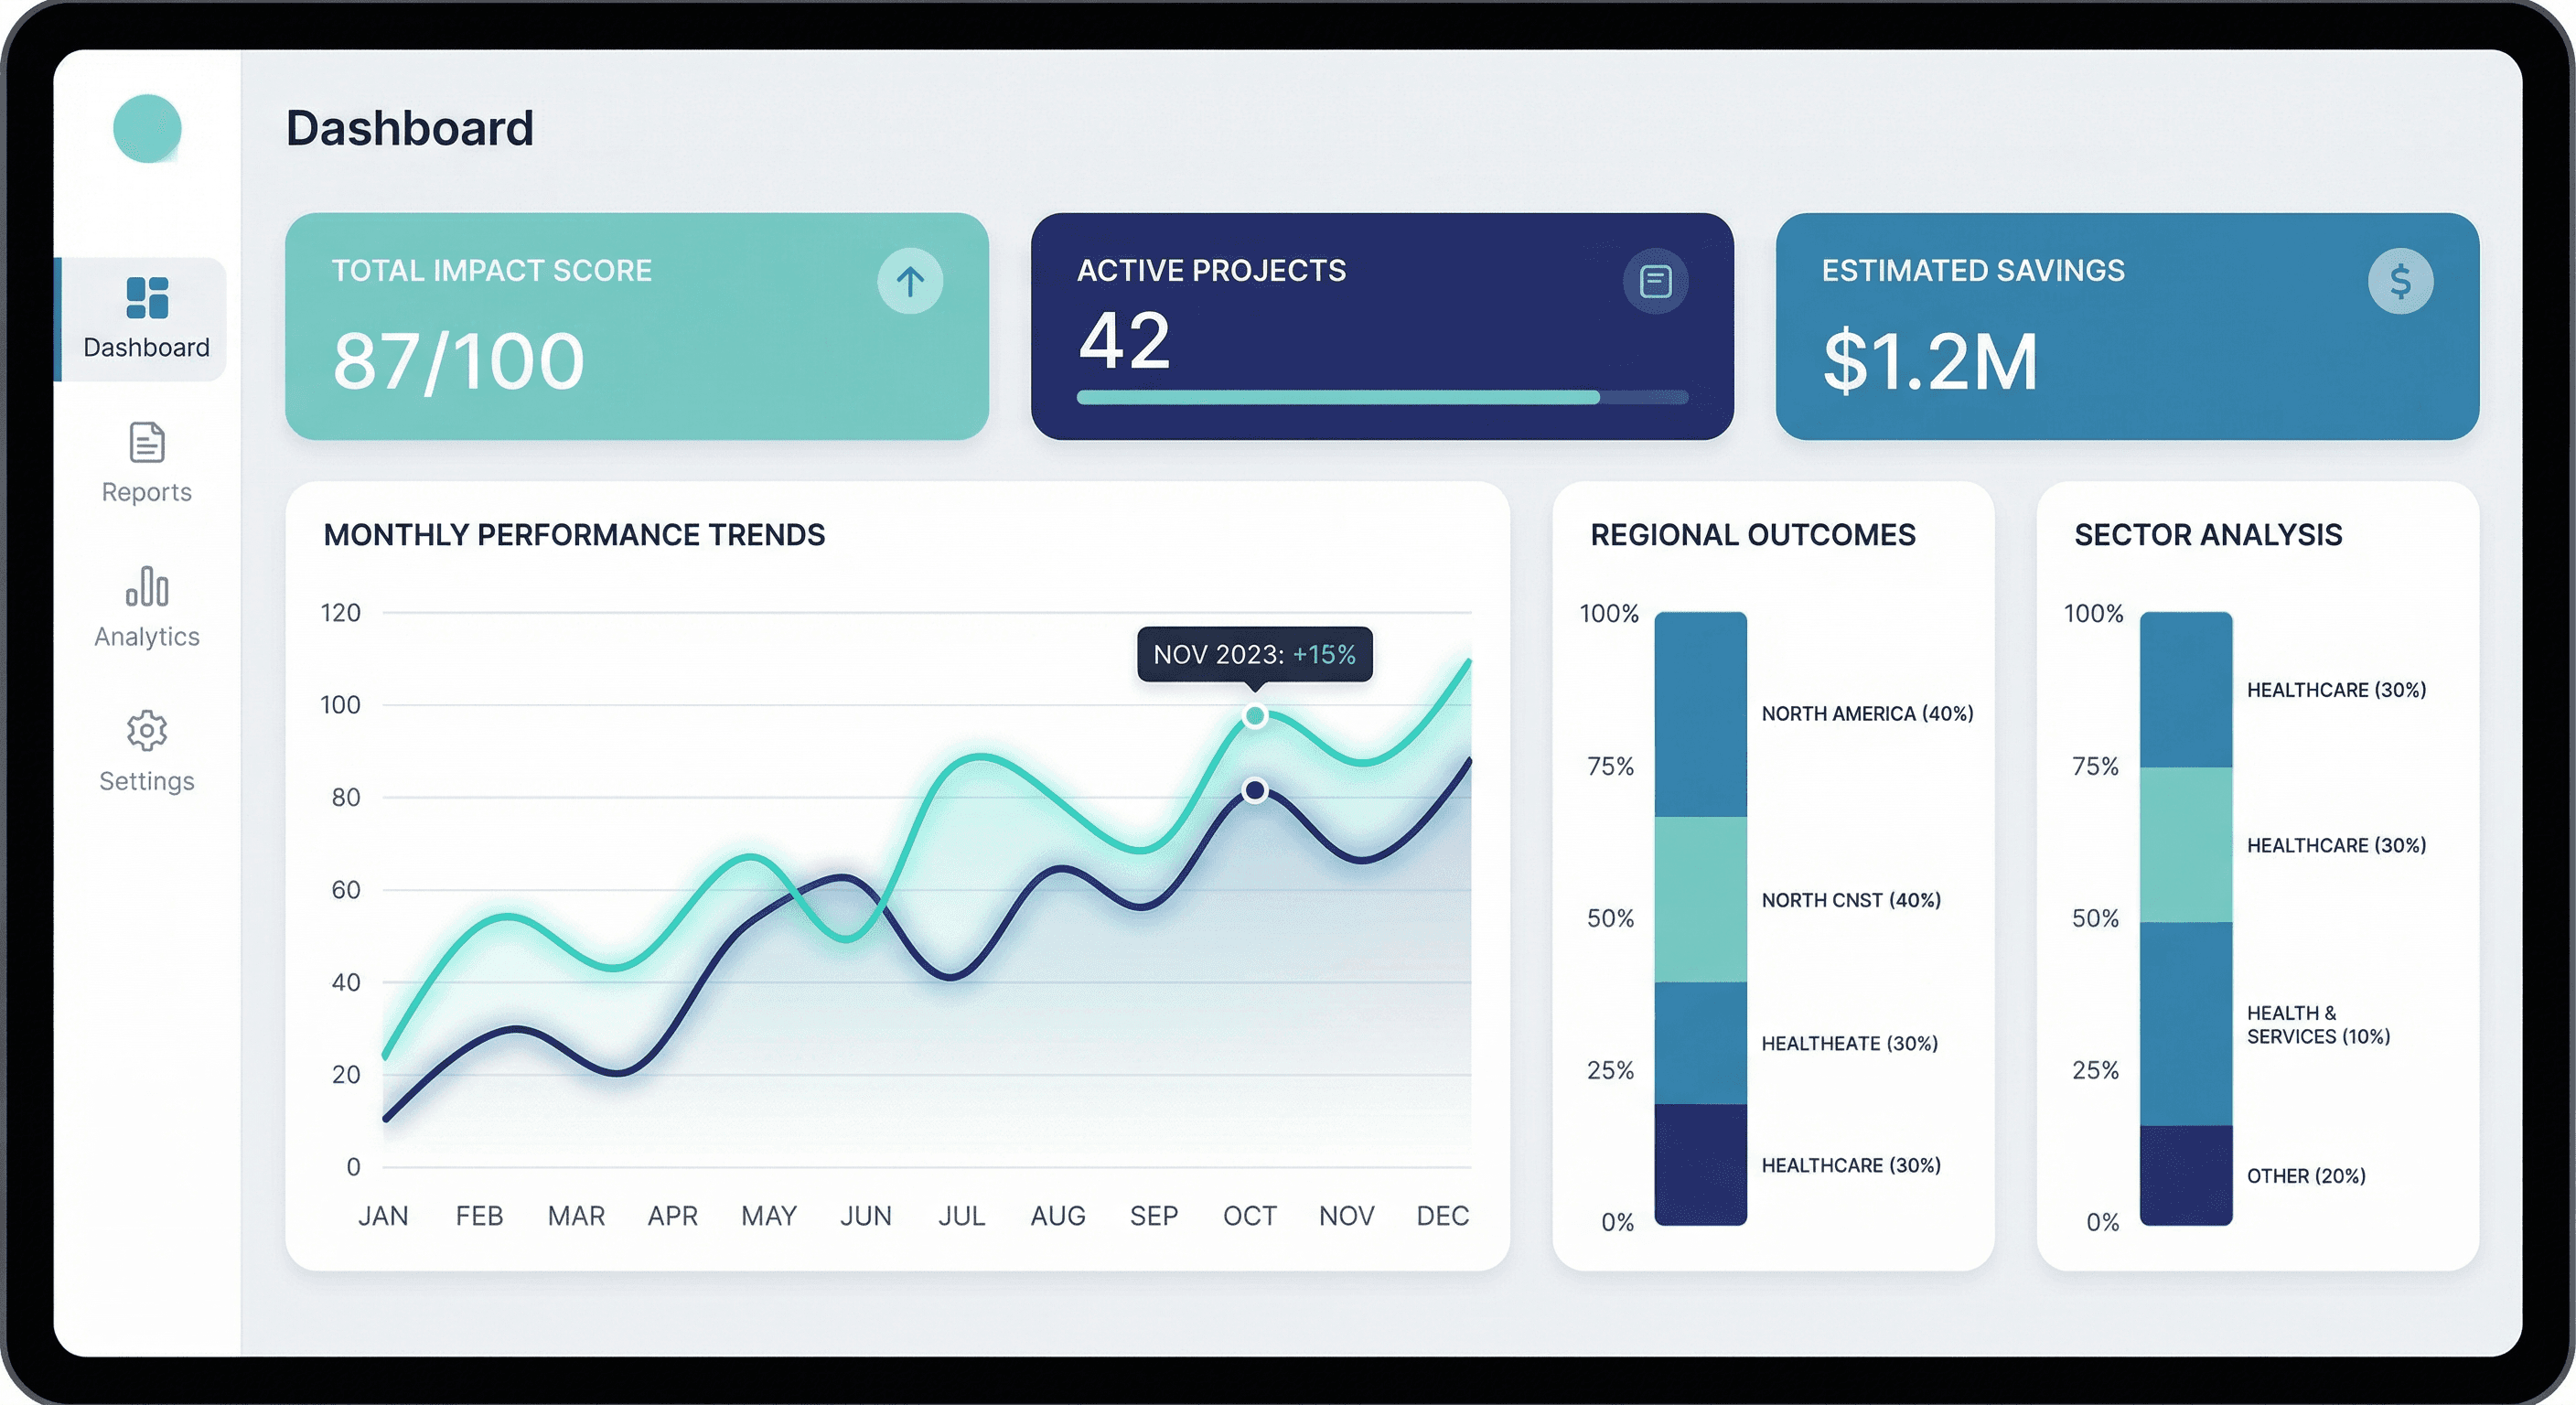
Value chains on MIS
How Impact Analytics Dashboards Works
We aggregate data across 48+ value chains, apply analytics and projections, and expose insights via dashboards and APIs.
Step 1: Connect your data sources
We integrate with partners to collect prices, production, and programme data in a secure, standardised way.
Step 2: Access dashboards and reports
View trends, benchmarks, and projections by value chain, region, and time period. Export for reports and planning.
Step 3: Use APIs for custom tools
Build your own apps and models using our APIs while we handle data quality and updates.
Step 4: Measure impact
Track outcomes and impact indicators for donors, investors, and internal learning.
Who Benefits
Cooperatives
Price visibility and member reporting for better decisions.
NGOs & projects
Real-time monitoring and impact reporting for donors.
Government agencies
Evidence for policy and programme design across value chains.
Financial institutions
Value-chain and price data to support lending and risk.